AIG’s Bond Sale is No Cause to Celebrate

The latest installment of the American International Group (AIG) “Bailout” is not the good news that one might imagine from reading AIG’s press release.   It does not provide as much financing as originally anticipated. More importantly, it is a reminder that, so far, the U.S. government has done much more to minimize losses for AIG’s counterparties than to maximize value for AIG.

AIG and the Federal Reserve Bank of New York announced on Tuesday that Maiden Lane II, an entity owned and controlled by the NY Fed, has purchased nearly $40 billion of mortgage-backed securities (RMBS) from AIG subsidiaries.  This was part of the revised U.S. government bailout announced on November 10th.  I described these arrangements in my article last week entitled, “AIG’s Bailout Needs a Bailout: A $150 Billion Problem.”

Edward M. Liddy, AIG Chairman and Chief Executive Officer, said: “AIG’s highest priority is the full repayment of the federal loan facility with interest. The creation and launch of this financing entity will eliminate the liquidity issues associated with AIG’s U.S. securities lending program, which will facilitate our repayment plan. Although we have more work ahead of us, this is an important step forward. We appreciate the support of the Federal Reserve Bank of New York in implementing this transaction.”  This seems to imply that this ‘financing entity’ is a new development that frees up AIG capital that otherwise would have gone to satisfy securities lending payables.

While the transaction is a means of financing AIG’s securities lending payables, it is part of the bailout plan and does not provide any capital beyond that anticipated in the bailout.  In fact, it provides somewhat less.  The illustration in AIG’s November 10th 10-Q1 filing shows a purchase price of $23.5 billion, based on fair market values on September 30th.  The actual transaction was based on lower values as of October 31st, and the purchase price was $19.8 billion instead of $23.5 billion.

In my previous analysis, I assumed, based on the 10-Q disclosure, that $23.5 billion would cover substantially all of the securities lending payables, and the financing would provide $22.5 billion, leaving $1 billion to be paid by AIG.  In the final deal, these payables required $24.9 billion – the $19.8 billion of sale proceeds plus a $5.1 billion capital contribution from AIG.  In other words, the final deal required an additional $4.1 billion from AIG.

The real bad news here is not that the value of these RMBS securities fell by $3.7 billion, or 15.7%, in one month; nor is it that AIG had to contribute $4.1 billion more to wind down its securities lending business.  The bad news is that until the deal was finalized, the NY Fed had the ability to make it a more effective tool for saving AIG, and now that chance is gone.

The NY Fed has purchased a portfolio of mortgage-backed securities for 50 cents on the dollar.  This price is more reflective of the lack of liquidity in the market than default rates.  It is likely that a price of around 80% of par would have more closely approximated the ultimate recovery if the securities were held to maturity.2 The NY Fed’s agreement to share a small portion3 of the gains with AIG after its loan to Maiden Lane II is repaid does little to help things today.  This should turn out to be a nice investment for taxpayers.

While some of the legal details have yet to be ironed out, it is clear that the U.S. government controls AIG.  The U.S. government can choose to maximize the long-term value of AIG’s most important assets – its reputation and its people – or it can focus on the salvage value of its financial assets.  Its actions to date indicate that it is focused more on the latter than the former.

So far, the U.S. government has made sure that banks, investment banks and other parties to AIG’s credit default swaps and securities lending agreements are made whole, even though these parties do not have the most senior rights as creditors.  Now that a partial list of the beneficiaries of these transactions has been made public, it is becoming clear that if these institutions had been forced to bear some loss as part of a negotiated deal outside of bankruptcy, the financial system would not have buckled.  The U.S. government made a policy decision to help certain members of the financial system that had transacted business with AIG, and has handed the bill to AIG.  Whether or not the policy decison is justified, forcing AIG to bear the entire cost is not.

Nearly all of the $170+ billion bailout has gone to fund losses on securities that are no longer on AIG’s balance sheet and have nothing to do with AIG’s go-forward business, so nearly all of the bailout funding arguably should have been funded off-balance sheet.  Instead, only about $50 billion is being funded off-balance sheet through Maiden Lanes II and III.

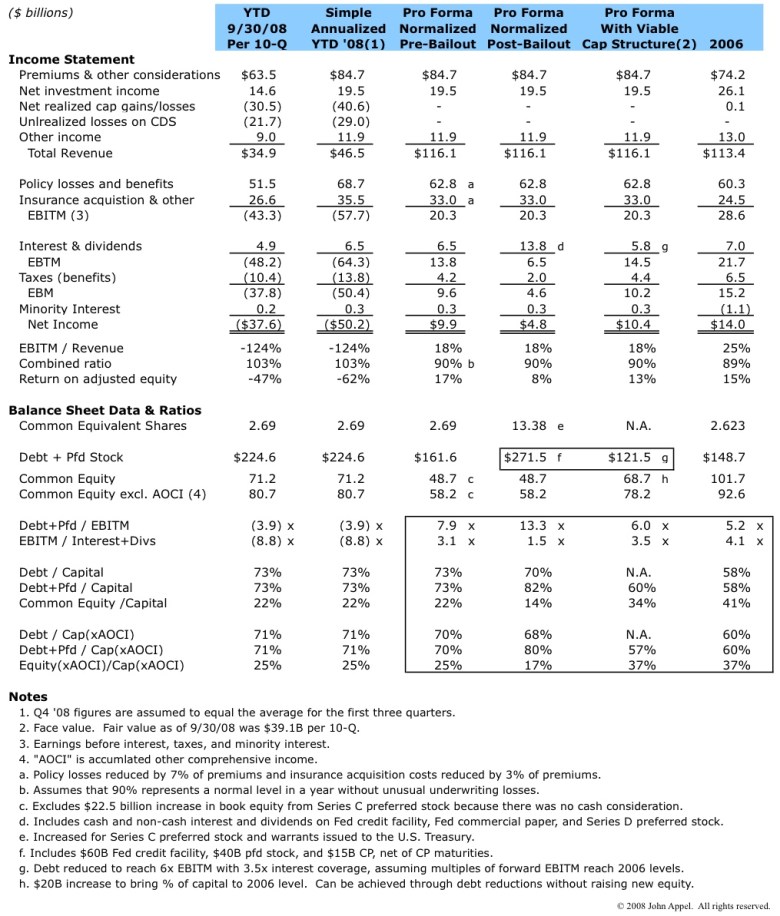
As a result, AIG is saddled with over $270 billion of debt and high dividend preferred stock, compared to under $150 billion in 2006.  As I explained in my analysis last week, the $270 billion needs to come down to around $120 billion before AIG’s balance sheet will truly be stabilized, and deserving of its ratings.  The plan is to achieve this through asset sales, but this is fallacy.  The current value of the assets targeted for sale is probably less than half of the amount needed.  Besides, the operating income from the targeted businesses4 may represent nearly half of AIG’s total normalized operating income, so if they were sold, the amount of debt that the remaining businesses could support would be far less than $120 billion.

AIG can limp along on “life support” for several years, since interest and dividends on $100 billion of the financing can just accrue instead of being paid in cash, but this just adds to the bill down the road.

The industry and AIG’s employees know that AIG’s current situation is not sustainable, and it is starting to show.  AIG disclosed in its 10-Q that its business is being negatively impacted by its financial instability.  And the company’s loss of senior executive Kevin Kelly to a competitor last week is just one example of what will happen to AIG’s executive ranks if things are not stabilized soon.

It is not clear if the U.S. Government cares about this, or if the intent is to break up the business, run-off the assets, and hope to recover at least the debt portion of the bailout funds.  It is not too late to choose the growth strategy over the wind-down strategy, but if growth is indeed the goal, the current course must change quickly.

Footnotes:

1 Please see the “Subsequent Events” section of AIG’s Q3 form 10-Q filed on November 10, 2008 (page 45).
2 As of September 30th, AIG’s RMBS included $14 billion each of Alt-A and subprime loans (the bulk of the rest was Agency and Prime). In October, 18.2% of all U.S. subprime loans were in foreclosure or REO, and another 10.4% were 90+ days past due (download data). Of all Alt-A loans, 9.3% were in foreclosure or REO and 4.8% were 90+ days past due (download data). Assuming that all of these end up in default and that the net recovery is zero, the total loss averages 21.3% between the Alt-A and subprime. The bulk of the RMBS were rated AAA, so they probably had about 10% subordination below them. Thus, assuming the securities sold to the NY Fed were evenly divided between Alt-A and subprime, the loss would be roughly (21.3%-10%)/90%, or 12.6%. This implies that a price of about 85% of par, or perhaps as low as 80% to allow a cushion, would have been a reasonable figure for the NY Fed to pay if the goal were to maximize the support of AIG while minimizing the loss to taxpayers. Instead, the NY Fed took advantage of the current dysfunction in the capital markets to buy the RMBS at a low price (for a scholarly article on how current market prices for mortgage-backed securities are below fundamental values, click here).
3 After the NY Fed loan is repaid, the first $1 billion (plus interest) of gains is paid to AIG subsidiaries, then the remainder is split 5/6 to the NY Fed and 1/6 to AIG subsidiaries.
4 Please see “Segment Information” on page 149 of AIG’s 2007 form 10-K for the operating income of AIG’s Life and Retirement Services businesses and aircraft leasing business.

(Disclosure: The author has no positions in AIG.)

Copyright © 2008-2009 by John G. Appel. All rights reserved. You may link to any Content on this website. You may not republish, upload, post, transmit or distribute any Content without prior written permission. If you are interested in reprinting, republishing or distributing Content, please contact John Appel via the e-mail address shown on this website to obtain written consent. Modification of Content or use of Content for any purpose other than your own personal, noncommercial use is a violation of our copyright and other proprietary rights, and can subject you to legal liability. Disclaimer: This website is provided for informational purposes only. Nothing on this website is intended to provide personally tailored advice concerning the nature, potential, value or suitability of any particular security, portfolio or securities, transaction, investment strategy or other matter. You are solely responsible for any investment decisions that you make. Terms of Use: By using the site, you agree to abide by the Terms of Use, which includes further copyright information and disclaimers.
Advertisement

AIG’s Bailout Needs a Bailout: A $150 Billion Problem

AIG could hardly support its pre-bailout debt, let alone an additional $115 billion of debt and dividend-bearing preferred stock.  For AIG’s balance sheet to be healthy again, leverage needs to come down by approximately $150 billion.  It appears unlikely that this can be achieved through asset sales.  AIG needs more immediate attention, and the company’s franchise value erodes each day that a permanent fix is delayed.

The original “bailout” consisted of an $85 billion credit facility with the NY Fed, in connection with which a trust for the U.S. Treasury purchased a 79.9% equity stake in AIG for $0.5 million.  The deal has since been revised and now totals approximately $168 billion, comprised of:

  • $115 billion provided directly to AIG, including:
    • The Fed credit facility, which was reduced to $60 billion;
    • $40 billion of preferred stock; and
    • Access to the NY Fed commercial paper program, through which $15.2 billion had been borrowed as of November 5th; and
  • $52.5 billion of off-balance sheet loans, including:
    • $22.5 billion to facilitate the termination of AIG’s securities lending program, and
    • $30 billion to facilitate the termination of certain CDS contracts. 1

The analysis below shows that AIG’s balance sheet was over-leveraged before the bailout, so the additional debt and preferred stock just compounds the problem.  The leverage piled onto AIG’s balance sheet, primarily to satisfy parties to its CDS and securities lending agreements, needs to be restructured again.

Windfall for CDS Counterparties and CDO Holders

AIG’s liquidity crisis became critical when rating agencies lowered AIG’s ratings by several notches last September, which triggered collateral calls on certain CDS contracts.  If AIG did not post required collateral, counterparties to the CDS agreements could terminate them, requiring AIG to come up with the full “notional”2 amount of the CDSs.  Termination payments would have been nearly twice as large as the collateral requirements.  The Fed credit facility enabled AIG to meet its collateral calls and avoid terminations.  Through November 5th, AIG had posted or agreed to post collateral totaling $39.9 billion with respect to credit default swaps.

The problems stemmed primarily from the unique terms of a small segment of AIG’s CDS portfolio with a notional amount of $71.6 billion or 19% of the $377.3 billion total CDS portfolio as of 9/30/08.  This segment, CDS agreements written on the “super senior”3 tranches of multi-sector CDOs, is unique in that the “exposure” on these agreements is not calculated using default models.  Instead, it is based on the market value of the underlying securities.  This feature greatly magnified the volatility and mark-to-market losses for these CDSs.4

click to enlarge

click to enlarge

Prices of the underlying securities5 suddenly plummeted after the initial Fed/Treasury deal, as market spreads shot up, so something more had to be done.  With the revised Fed/Treasury deal came a plan to terminate the “super senior” CDS contracts after all, and purchase the underlying CDOs.  Of the $52.5 billion in off-balance sheet financing referenced above, $30 billion is a loan to Maiden Lane III LLC (ML III), an entity formed by the NY Fed and AIG to purchase (at market value) $64.7 billion face value of the “super senior” CDO tranches on which AIG had written CDS agreements (AIG invested $5 billion in ML III).  In connection with the purchase of the CDOs, the related CDS agreements are being terminated.6

This is a huge windfall for the holders of these CDOs,7 which go from owning extremely illiquid securities carried on their balance sheets at pennies on the dollar, to getting cashed out at or near par (through the combination of the market purchase of the CDOs and the CDS collateral and termination payments).  Prior to the initial Fed/Treasury bailout, these parties could have threatened to put AIG into bankruptcy if AIG did not post the required additional collateral, but in reality their negotiating leverage was limited.  The collateral they held was only a fraction of the amount owed to them if the CDS agreements were terminated, and their unique status in bankruptcy as parties to “financial transactions” only gave them the ability to keep the collateral they had.  Their additional claims would likely have been treated like any other prepetition unsecured claims.8 Despite their questionable seniority, they are being made whole.

There are probably some senior secured creditors of AIG that wish they got the same deal….

The $150 Billion Problem

While it is difficult to calculate precisely how much debt AIG’s operations can support, the analysis below provides an approximation.

One can get a sense of AIG’s potential normalized revenue and operating profits, and the debt that can be supported by those profits, by going back to 2006, when the performance of AIG’s Financial Products group had little impact on the business.  Below is a summary of relevant 2006 financial data.

click to enlarge

The table shows that 2006 was a banner year for AIG.  With low losses and high investment returns, earnings before interest, taxes and minority interest (EBITM) was 25% of revenue, and the company had a 15% return on adjusted equity.  Debt amounted to about 5x EBITM and interest coverage (EBITM/Interest) was about 4x.  Presumably this was the type of leverage multiple and interest coverage that was necessary to maintain its ratings.

The table below compares 2008 to 2006.  For 2008, the table shows actual results for the year-to-date ended 9/30/08, annualized YTD 2008 results, and pro forma normalized results with and without the bailout.  One can see in the third column that AIG was over-leveraged before the bailout, with debt of nearly 8x normalized EBITM.  More debt and preferred stock was the last thing AIG needed.  The bailout leaves AIG leveraged at over 13x normalized EBITM, with interest coverage of only 1.5x.  To bring its leverage and capital ratios back to 2006 levels, it appears that AIG needs to reduce its debt and preferred stock by $150 billion (the difference between what is shown in the fourth and fifth columns).

click to enlarge

click to enlarge

Asset Sales – Too Little Too Late

AIG and the architects of the bailout knew that the structure was not a permanent fix, but anticipated that sufficient assets could be sold to repay the U.S. government funding and achieve the deleveraging needed to stabilize the balance sheet.  The main assets identified for sale are the aircraft leasing business (ILFC) and the life insurance operations.  I estimate the book value of ILFC at approximately $10 billion.9 With approximately $1 billion in operating income, ILFC would probably sell for about 1x book value in a normal economic environment, but in the current environment, I would not be surprised if the number is half this amount.  I estimate the unlevered book value of the Life Insurance and Retirement Services business at roughly $135 billion.10 Given that operating income for this segment is in the range of $8-10 billion, it is hard to imagine even the most strategic buyers paying 1x book.  A more realistic figure today might be closer to $80 billion (about 1.5x revenue and a high single-digit multiple of operating income).

Whether these assets are sold in the near term, for proceeds perhaps in the range of $80-90 billion, or a few years from now for something closer to $150 billion, it will not be enough to fix AIG’s balance sheet.  While debt would be reduced, operating cash flow to service debt would be reduced as well, so the remaining business would still be over-leveraged.

One Potential Solution

AIG attempted to raise capital in the private sector, enlisting the help of Blackstone, J.P. Morgan, and Goldman Sachs.  The company spoke to private equity funds, sovereign wealth funds and other potential investors.  J.P. Morgan and Goldman tried to syndicate a $75 billion lending facility – but all of these attempts failed.  AIG summarizes this whole saga here.

Given the state of AIG’s balance sheet, the unknown (and perhaps unknowable) risks in its investment portfolio, litigation risks from disgruntled shareholders and others, and many other factors, it is likely that the private sector would have required AIG to reorganize through Chapter 11.  The company’s total obligations were just too big to be met from present or foreseeable cash flows of the business.

If it is in the best interest of the global financial system for AIG not to go through Chapter 11, then the U.S. government should help engineer an alternate way to remediate AIG’s balance sheet permanently, not just plug a short-term liquidity gap by adding even more debt and dividend-bearing preferred stock.

There are many ways in which AIG and the U.S. government could address this.  One possible approach would be:

  • The Fed or Treasury purchase AIG’s investment in ML III for $42 billion in debt reduction (the Fed and/or Treasury would then own the “super senior” CDOs at par);
  • Instead of the Fed lending $22.5 billion to Maiden Lane II to buy RMBS securities from AIG (in connection with the wind-down of AIG’s securities lending program), the Fed buy the securities from AIG for $22.5 billion in cash plus $17.5 billion of debt reduction (the Fed and/or Treasury would then own the RMBS at par);
  • The Treasury exchange its Series D Preferred Stock for a new series of convertible preferred stock that converts at a price based on the price of the common stock at some future date, and sell its Series C Preferred Stock and warrants back to AIG at cost; and
  • AIG sell (at net book value) businesses with expected net asset values of over $50 billion to an entity jointly owned by AIG and the NY Fed or Treasury in return for a cash payment to AIG of $50 billion.

The sum of these actions would reduce AIG’s net debt and dividend-bearing preferred stock by an aggregate of $150 billion; increase book equity by perhaps $30 billion; and enable the complete pay-down and termination of the Fed credit facility.  AIG would have a healthy balance sheet immediately and could refocus on building its businesses and shareholder value.  Taxpayers would ultimately be paid back through the CDO and RMBS pools, the orderly sale of business assets, and the eventual conversion and sale of the new preferred stock.

There are many other approaches one could use to achieve similar results, but one way or another, the current Fed/Treasury deals need to be restructured.

(Disclosure: The author does not own any interests in American International Group, except indirectly as a United States taxpayer.)

Footnotes:

1 Below is a more detailed summary of the revised agreements with the Fed and Treasury. For an even more complete description, please see footnote 11 to AIG’s Q3 financial statements (“Subsequent Events” – beginning on page 43).

  1. Certain AIG subsidiaries entered into a securities lending agreement with the NY Fed, through which the NY Fed provided liquidity to AIG by borrowing, and posting cash collateral for, $19.9 billion of securities.  Since then, AIG and the NY Fed have formed a special purpose entity, Maiden Lane II LLC, to buy $40 billion face amount of RMBS from AIG subsidiaries for $23.5 billion in connection with the termination of AIG’s U.S. securities lending operations.  The NY Fed will be repaid the $19.9 billion of collateral with a portion of the proceeds.
  2. The NY Fed agreed to lend up to $30 billion to a special purpose entity, Maiden Lane III LLC, formed to purchase (on market terms) the CDOs underlying most of the credit default swaps written on “super senior” multi-sector CDOs.
  3. Affiliates of AIG were given access to the NY Fed commercial paper program, through which $15.2 billion had been borrowed as of November 5th to enable AIG to pay down borrowings under the Fed credit facility to $61 billion from $77 billion.
  4. The U.S. Treasury invested $40 billion in Series D preferred stock with a 10% dividend rate.
  5. The U.S. Treasury was given warrants for 2% of AIG’s common equity.
  6. Terms of the Series C convertible preferred stock provided to the Treasury in connection with the Fed credit facility were modified so that it is convertible into 77.9% of the common shares instead of 79.9%.
  7. The Fed credit facility was reduced from $85 billion to $60 billion, and the interest rate was reduced to LIBOR plus 3%.

2The “notional amount” is the face amount of reference securities on which the credit default swap is written.
3The super senior tranche is one that is not exposed to default risk until the less senior tranches, including the AAA-rated slice just below the super senior slice, have been wiped out. As of 9/30/08, multi-sector CDOs on which AIGFP wrote protection on the super senior tranche had a gross notional amount of $108.5 billion, of which the super senior tranche was $71.6 billion, with the difference being the subordinated layers that would need to be exhausted before the super senior tranche would experience a loss. Below is a graphical representation from AIG’s Q3 10-Q:

4 Most of these agreements also require physical settlement, meaning that instead of a cash settlement equal to the difference between the notional amount of the CDS and the “exposure” on the settlement date, the agreements require AIG to deliver the full notional amount of the CDS in return for delivery of the underlying securities.
5 The multi-sector CDOs were comprised of prime RMBS (11.3%), Alt-A RMBS (15.8%), subprime RMBS (37.1%), CMBS (21.5%), CDOs (9.4%), and other (4.9%) [Note: CDO percentage corrected 1-6-09].
6 As of November 25th, $46.1 billion of CDOs had been purchased and a corresponding notional amount of CDS agreements terminated, with the remaining $18.6 billion in process (See Form 8-K for more details).
7These CDO/CDS holders include Société Générale, Goldman Sachs, Deutsche Bank, Crédit Agricole, and Merrill Lynch (Source: WSJ).
8 Changes to the Bankruptcy Code in 2005 and 2006 expanded the rights of CDS counterparties in a bankruptcy, but the main effect was to enable these parties to enforce termination provisions and collect collateral. Any claims not satisfied by the collateral are still treated as prepetition claims (11 U.S.C. § 502(g)(2)).
9 $45 billion of identifiable assets as of 9/30/08 less $35 billion of ILFC debt leaves $10 billion of net assets. There are probably other operating liabilities of ILFC, so the actual book value is likely to be lower.
10 Identifiable assets of $615 billion as of 12/31/07 per 10-K, less $30 billion change in invested assets as of 9/30/08, less $450 billion reserves, contract deposits, DAC/VOBA & SIA leaves $135 billion of net assets excluding debt.  As with ILFC, the actual book value is likely to be lower.

Copyright © 2008-2009 by John G. Appel. All rights reserved. You may link to any Content on this website. You may not republish, upload, post, transmit or distribute any Content without prior written permission. If you are interested in reprinting, republishing or distributing Content, please contact John Appel via the e-mail address shown on this website to obtain written consent. Modification of Content or use of Content for any purpose other than your own personal, noncommercial use is a violation of our copyright and other proprietary rights, and can subject you to legal liability. Disclaimer: This website is provided for informational purposes only. Nothing on this website is intended to provide personally tailored advice concerning the nature, potential, value or suitability of any particular security, portfolio or securities, transaction, investment strategy or other matter. You are solely responsible for any investment decisions that you make. Terms of Use: By using the site, you agree to abide by the Terms of Use, which includes further copyright information and disclaimers.
www.aptacapital.com John Appel

Reinsurer Stocks: A Fear-Driven Market Creates Opportunity

Catastrophes both natural and man-made have been hitting reinsurance companies, but the outlook is good.  Shares of all the reinsurance companies were pummeled in October, with the combination of Hurricanes Ike and Gustav hitting underwriting profits while the capital markets carved a mark-to-market chunk out of investment portfolios.  Things seemed to improve around Halloween and into November, as signs of “hardening” premium rates began to emerge.  But shares have recently retested their lows as the dysfunctional capital markets – especially for mortgage- and asset-backed securities – overshadow improving fundamentals for the group.  This has created opportunity for the intrepid value investor.

* Does not include AIG, BRK, and XL.

I evaluated a dozen reinsurers based on factors including:

  • underwriting and overall profitability;
  • historical and expected premium growth;
  • financial strength ratings;
  • fixed income portfolio make-up, duration and average ratings;
  • financial leverage; and
  • capital adequacy.

Table 1 lists these companies in order of total capital, along with relevant market value multiples, some key performance metrics, and my per-share valuation of each company based on fundamental analysis (except for AIG (AIG) and Berkshire Hathaway (BRK-A), which I include for comparison but don’t value).  Table 2 provides information on their investment portfolio quality.  Table 3 shows debt-to-capital ratios and a ratio I use a rough indication of capital adequacy: the ratio of cash and investments to loss reserves.

Table 1 – Reinsurer Market Multiples, Key Metrics & Target Price
* Medians exclude Berkshire Hathaway and AIG. See endnotes for an explanation of terms and calculations.

The companies that trade (as of 11/24/08) at the steepest discount to my estimated “fundamental” values are ACE Limited (ACE), Axis Capital (AXS), PartnerRe (PRE), Validus (VR), and XL Capital (XL).  Below is a brief discussion of each company:

Table 2 – Fixed Income Portfolio Quality
* Medians exclude Berkshire Hathaway and AIG. See endnotes for an explanation of terms and calculations.
  • ACE Limited, founded in 1985, is a Zurich-based leading global property & casualty, life, and accident & health insurance company and reinsurance company with operations in more than 50 countries.  Its ACE Tempest reinsurance operations are well respected but comprise less than 10% of ACE’s consolidated net written premiums.  Reinsurance net written premiums are down over 22% YTD, but its prospects for growth are good, as ACE has the scale and reputation to capture significant business from AIG at January renewals.  ACE has the best YTD combined ratio of the group.  The quality of its fixed income portfolio is about average for the group, and its make-up and duration are consistent with its insurance business mix.  As of 9/30, ACE had $5.5 billion of asset-backed securities (“ABS“) and non-agency mortgage-backed securities (“MBS“) in its portfolio, including $2.3 billion of commercial mortgage-backed securities (“CMBS“).  Given that spreads have recently skyrocketed for these securities (see chart, below), ACE is likely to report more unrealized investment losses in the fourth quarter (a 100 basis point yield increase equates to a +/-350 bp price reduction on a portfolio with a 3.8 year duration, or over $1 billion on ACE’s $36 billion fixed income portfolio). These unrealized losses should have little real impact because ACE should not need to sell its structured securities (at least not in this market), but it seems that investors need little incentive to punish a stock these days, so value investors should see further buying opportunities.
    CMBS Spreads
    cmbx-2-spread-11-24jpg
    click image to enlarge
  • Axis Capital is a Bermuda-based specialty P&C insurer and reinsurer, founded in November 2001.  Reinsurance is the majority of its business.  Property, professional lines and catastrophe are its largest business lines, representing 26%, 21% and 16% of gross premiums written.  These businesses should all see firming rates in 2009.  Its fixed income portfolio is higher rated on average than most at AA+ and the average duration is shorter than most at 2.9 years.  It includes $1.7 billion of ABS and non-agency MBS (including $860MM CMBS).  The relatively short portfolio duration means that an increase in credit spreads not only will have less effect, but also is more likely to be offset by yield curve changes.  One potential portfolio risk is the $636 million of hedge funds, credit funds and CLO equity tranches, for which marks vs. cost are not disclosed.  However this exposure is only 13% of book value.  AXS is very well capitalized relative to its current book of business, and its debt-to-capital is the lowest of the group at only 9%, so the company is quite well positioned to grow.  S&P gives it an “A” rating but a “positive” outlook – the only “positive” for the group.  Its management team is strong and seasoned, and its level of capitalization and other metrics are more representative of an A+ company, so it is likely that its relatively short operating history has been the only thing holding it back from an A+.
  • PartnerRe, based in Bermuda, was founded in 1993 and is the 10th largest global reinsurer, with lines of business that are well diversified by risk category and geography.  Premium growth YTD was driven by opportunistic business in the agriculture sector; other lines of business declined consistent with the group (when adjusted for one-time items).  A principal reason for the decline was greater risk retention by ceding insurers.  With insurer balance sheets constrained and little ability to reload in the current capital markets environment, risk retention by primary insurers is less likely to impact growth in the next year or two.  The company is well positioned with its “AA-” S&P rating.  PRE’s combined ratio was an attractive 91.4% despite hurricane losses in Q3, which speaks to the company’s underwriting discipline and ability to generate profitable growth.  PRE’s investment portfolio has only $825MM of ABS and non-agency MBS, although widening credit spreads on its $1.3 billion of finance sector corporate bonds (banks – $600MM) will also have an impact.  Unrealized losses will hit earnings, not just comprehensive income, because PRE elected “fair value” treatment under FAS 159 this year (ACE, AXS, VR and XL continue to flow unrealized losses through comprehensive income, except that ACE made the FAS 159 election for its equity securities).
  • Validus Holdings, based in Bermuda, was formed in December 2005.  Through Validus Re, it is a leading writer of property catastrophe insurance and also writes marine, energy and other specialty, short-tail lines.  VR writes direct insurance through Lloyds syndicate member Talbot, which it acquired last year.  VR was initially capitalized by private equity groups Aquiline Capital, Vestar Capital Partners, New Mountain Capital, and private equity affiliates of Goldman Sachs and Merrill Lynch.  The company went public in July 2007.  VR is very well capitalized for the size of its current business, with cash and investments of 2.7x loss reserves, and debt-to-capital of only 13.7%.  Its “A-” rating from A.M. Best is typical for the Bermuda “Class of 2005” and more indicative of its limited track record than its financial health and operations.  Its combined ratio YTD is still 93% even after Ike and Gustav took it up to 122% in Q3.  ABS and non-agency MBS of $653MM is 34% of book value but the average rating for the total portfolio is “AAA-” and the duration is a low 2.2, which is consistent with its short-tail focus and should provide some cushion against widening credit spreads.  Growth was flat last year (pro forma for Talbot) but VR is very well positioned to grow next year.
  • Table 3 – Leverage and Capital Adequacy
    * Medians exclude Berkshire Hathaway and AIG. See endnotes for an explanation of terms and calculations.
  • XL Capital, based in Bermuda and founded in 1986, is a diversified P&C insurance, life insurance and reinsurance company with 77 offices in 27 countries.  Its reinsurance businesses are ranked among the 12th largest globally.  XL’s situation shows how confidence is much easier lost than regained, and is a good example of how, in today’s environment, investors sell first and ask questions later.  XL’s price/book multiple is lower than AIG’s, and from its stock price trajectory, one would think that XL was headed for the same explosive fate, but without a bailout.  However, XL’s current operating performance, and even the rating agencies that give XL a “negative” outlook, paint a much more positive picture.  The rating agencies say XL has “strong” capital adequacy.  XL’s debt-to-capital ratios in Table 3 do not reflect that $745MM of debt converts to equity on 2/11/09. On a pro forma basis, debt/capital and debt+pfd/capital are a very reasonable at 17% and 27% respectively.  Its fixed income portfolio has an average rating of “AA,” on par with the group, and an average duration of 4.1 years, the same as PRE and lower than Everest Re and Odyssey Re.  XL’s ABS and non-agency MBS is slightly higher than the group as a percentage of book equity, at 77%, but lower than RenaissanceRe (RNR) and Endurance (ENH) as a percentage of total cash and investments.  Its CMBS portfolio is now at $2.4 billion, after $800MM was sold in Q3, bringing it close to ACE’s $2.3 billion level.  Its 10% decline in premiums written this year is about the same as for Everest and RenaissanceRe, and less than Berkshire’s 25% decline or ACE’s 22% drop in reinsurance premiums.  Besides, sacrificing growth for pricing discipline is a virtue.  Its combined ratio of 97.7% YTD is better than Everest (RE), Odyssey (ORH), Endurance and AIG, and about the same as AXS.  None of this explains the 85%+ drop in XL’s share price this year.  There must be more to the story….

A Closer Look at XL

1. Guilt by Association with Credit Default Swaps

Most of XL’s problems stem from the financial guaranty company, Syncora (SCA).  Formerly known as Security Capital Assurance, Syncora was a subsidiary of XL Capital until XL brought its ownership below 50% through secondary market sales following Syncora’s 2006 IPO.  Last year and earlier this year, XL Capital had a real mess on its hands because Syncora was facing serious issues with credit default swaps – very much like AIG – and XL Capital was on the hook for some of the risk.

In addition to the Syncora issues, XL had it’s own challenges, including the integration of several acquired businesses, strengthening its enterprise risk management systems, and de-risking an investment portfolio that had become too heavily laden with mortgage-backed securities.

In March of this year, XL announced that it was bringing in a new CEO, Mike McGavick, to turn things around.  Mike had a great track record of success at CNA and at Safeco, which he substantially turned around in less than a year.  A number of his moves at XL look like they come straight from his Safeco playbook: move quickly and get the financial pain out of the way; look to pay down debt through asset sales; invest in systems in order to wring efficiencies out of poorly-integrated acquired businesses, and ruthlessly drive down costs wherever possible.

CDS = “Collateralized Death Spiral”
cds-spiral

Mike’s most immediate challenge was Syncora.  As the credit quality of the debt underlying Syncora’s credit default swaps eroded, it faced the same death spiral – ratings cuts, collateral calls, security sales, capital drain, ratings cuts, collateral calls… – that hobbled AIG.  XL was only a minority owner of Syncora, but as of 6/30/08 still had exposure through guarantees and reinsurance to a whopping $65.7 billion net par value of pre-IPO contracts.

Even though XL’s actual exposure under these contracts was estimated to be only $1.0-$1.5 billion, write-downs related to Syncora were damaging its financial statements – and its reputation.  In July, Chubb was reported to have taken XL off of its approved list of markets for facultative reinsurance.  S&P, Moody’s and Fitch all gave XL a negative outlook, citing its Syncora exposure.

XL needed to get out from under the Syncora cloud fast (and Syncora needed cash), so on August 5th, XL paid $1.8 billion plus 8 million common shares to erase over 98% of this risk through a settlement agreement with Syncora and certain of its counterparties (XL also transferred its remaining Syncora shares to a trust for Syncora CDS counterparties).  This payment was funded with part of the $2.9 billion in new preferred stock and equity units issued this year, so the company’s cash balance was still improved versus the beginning of the year.

XL has put its Syncora exposure behind it, but it has been much harder for the company to undo the damage to its reputation.  It didn’t help XL that at the same time that it announced the earnings hit for the Syncora settlement, it reported over $1 billion in mark-to-market losses on its fixed income portfolio.  Most of the losses were non-cash – approximately $825MM was unrealized losses due primarily to increasing credit spreads.  However, the combination of these charges was enough to trigger rumors that the company was on the brink of insolvency.  These rumors prompted management to host its earnings call before its third quarter numbers were finalized, and to release detailed data on its portfolio.  So far, investors seem unconvinced.  What XL needs is more third party validation.

A.M. Best upgraded its outlook from negative to stable following the Syncora settlement, and said that with McGavick at the helm, Syncora behind it, and its latest round of new capital, the company now has the resources befitting a strong insurance franchise.  However, S&P, Fitch and Moody’s still have a negative outlook.  Chubb has not, as far as I can tell, put XL back on its preferred insurer list.

S&P and the rest actually say some very positive things about XL, but until they change their official outlook, it is likely that investors will focus more on the negative headline than the positive story.  In maintaining its negative outlook, S&P cites “a track record of inconsistent earnings performance; material, though reduced, exposure to large catastrophic losses; susceptibility to further declines in the investment portfolio; and business-integration challenges borne from the relatively rapid building of a very strong and diversified global competitive position.”  However, S&P also makes a number of positive comments:

Pro forma Sept. 30, 2008, capital adequacy is strong and incorporates both the market valuation of XL’s investment portfolio and expected Hurricane Ike and Gustav losses that, though material, were within our expectations. …

We expect XL to produce a strong, steady earnings stream from its ongoing core operations at a level equal to that of similarly rated peers, despite soft market pressures. An accident-year and calendar-year combined ratio of less than 100% and a pretax return on revenue (excluding realized gains or losses) of 15% will result from continued pricing discipline and operating performance, absent an unusually severe catastrophe year. Furthermore, financial leverage (debt plus preferreds including hybrids) will be no more than 40% of total capital when reflecting the February 2009 conversion of $745 million of senior notes into equity, and fixed-charge coverage (excluding noncash and unusual charges) will approach 5.5x in 2008 and 2009.

It seems clear that S&P’s reluctance to lift its “negative” outlook is based more on XL’s history than its present status, and that barring any significant missteps, the outlook will be upgraded.  However, it could take some time.  S&P implies that it will need to monitor results for the next “couple of years” before changing its outlook.

2. Investment Portfolio and Business Risks – Real but Declining and Manageable

Since the Syncora settlement did little to help XL’s stock price, I dug deeper into the two other logical issues: the investment portfolio and the risk portfolio.  S&P and A.M. Best both mention XL’s investment performance, and it is clear from my conversations with people in the industry that there are still concerns about what may be lurking in XL’s portfolio.

I looked at XL’s Q3 credit supplement, which provides a substantial amount of detail on the portfolio, including marks versus par and amortized cost.  I put together a summary of the data, which shows that fair values seem reasonable, especially when considering the true likelihood of nonpayment rather than temporary swings in treasury rates and credit spreads.  XL has $1.3 billion of subprime, Alt-A and second lien loans; however, even the AAA-rated portion of this ($800MM) is carried at 75% of par.  The A-rated portion ($300MM) is carried at only 41% of par.  The combination of actual credit impairments and today’s insane credit spreads justifies these marks, but it is hard to imagine that 25% and 59%, respectively, of these loans actually will not be repaid.  Its $758MM of non-ABS CDOs are carried at 64% of par.  Its CMBS are marked at 88% of par, even though default rates for commercial mortgage-backed securities historically have averaged less than 1%.  The only mark I question is carrying its $1.4 billion of consumer ABS at 99% of par.  XL management has acknowledged the concerns about its portfolio and has already reduced its levels of riskier debt securities and equities. Overall, the portfolio has its issues, but nothing that would justify XL’s current stock price.

One last thing I considered was XL’s exposure to D&O claims.  About 24% of XL’s business is professional liability, and a recent study by Advisen Ltd. ranks XL as the third largest writer of D&O coverage for financial institutions, with an 11% market share.  The rest of the top five are AIG (19%), Lloyds (17%), Chub (10%) and Travelers (6%).  The study predicts that settlements and defense costs for subprime-related D&O claims will be $27 billion, of which the insured portion will be $5.9 billion.  This would put XL’s share at $650 million, or 6.5% of book value.  This is material, but, again, not enough to explain the current stock price.

The Power of Rumor Over Reality

I spoke to some of my contacts in the industry to try and get to the bottom of this.  They talked about XL having a lot of “those toxic subprime” securities in the portfolio, and XL’s having been involved in the whole credit default swap nightmare – nothing new.  The good news was that I also heard that XL was “an important market” for them, and that they had not heard anything negative about XL lately. When I probed for details about XL, it became clear that nobody I spoke to had done any primary research.  Their views were driven by industry chatter, which in this case seems to lag, not predict, reality.

The time to make a negative call on XL was in late 2007 and the first half of 2008.  By the time the negative buzz reached its peak in October ’08, the vast majority of XL’s problems were already behind it.

XL has raised new capital; virtually eliminated its Syncora problem; made progress in de-risking its investment portfolio (including the $800MM reduction in CMBS mentioned earlier, plus a $500MM reduction in corporate credits and other actions); and hired a new “Chief Enterprise Risk Officer” from Goldman Sachs.  While XL is likely to have another significant round of mark-to-market losses in the fourth quarter, this will impact “comprehensive income” not net income.

The market has priced disaster into XL’s shares, but while I see challenges, I do not see any signs of impending doom.  Mike McGavick has the skills and experience to lead a successful turnaround and has already made real progress.  Meanwhile, premium rates for property, catastrophe and professional lines are already firming and the outlook is very good for XL in 2009.  The conversion of its senior notes to equity in February of 2009 may be a catalyst for significant appreciation of the stock, especially if XL fares well during January renewals.  Unfortunately for XL, unless credit spreads tighten dramatically by year-end (the Fed is certainly pushing in the right direction), it is likely that Q4 mark-to-market losses will offset, or at least temper, positive Q1 news.  One thing that would help would be if following Q4 results, one of the other rating agencies revises its outlook to “stable.”

Notes:

“Total Capital” refers to book equity plus minority interests, liquidation preference of preferred stock, and debt. “Capital” refers to “Total Capital” excluding accumulated other comprehensive income (“AOCI“). “Book” and “Book Value” refer to book common equity excluding AOCI. Prices are closing prices on 11/24/08. “Unlevered Value” is equity market value plus minority interest, preferred stock and debt, less an estimate of excess cash for RNR and VR.  Premiums earned are for LTM ended 9/30/08.  Company ratings are S&P financial strength ratings, or, if there is no FSR, ratings for the P&C operating companies. Validus rating is from A.M. Best.  Portfolio average ratings are S&P except Everest, which is Moody’s.  Figures for ORH are pro forma for an additional $150MM of share repurchases at an assumed $45/share average price. For AIG, figures: (1) are pro forma for the issuance of $40B Series D Pfd Stock and associated debt repayments, (2) do not include non-cash addition to APIC recorded with Series C Pfd Stock, (3) reflect preferred stock on an as-converted basis, and (4) include $156B of “other long-term borrowings” at face value, not $39.1B reported fair value.

Copyright © 2008-2009 by John G. Appel. All rights reserved. You may link to any Content on this website. You may not republish, upload, post, transmit or distribute any Content without prior written permission. If you are interested in reprinting, republishing or distributing Content, please contact John Appel via the e-mail address shown on this website to obtain written consent. Modification of Content or use of Content for any purpose other than your own personal, noncommercial use is a violation of our copyright and other proprietary rights, and can subject you to legal liability. Disclaimer: This website is provided for informational purposes only. Nothing on this website is intended to provide personally tailored advice concerning the nature, potential, value or suitability of any particular security, portfolio or securities, transaction, investment strategy or other matter. You are solely responsible for any investment decisions that you make. Terms of Use: By using the site, you agree to abide by the Terms of Use, which includes further copyright information and disclaimers.

JDA’s Retrade is Justified

JDA Stock Price vs. Nasdaq-100 Tech Index

JDA Software Group (Nasdaq:JDAS) has had an offer on the table to buy i2 Technologies (Nasdaq:ITWO) for $346 million, or $14.86 per share.  However, JDA recently notified i2 that its financing terms for the current deal are too burdensome, and indicated that it wants to adjust the purchase price downward.

So far, i2 has kept pressure on JDA to close the deal at the current price.  But given the recent drop in i2’s stock price from $14.60 to under $9, investors are clearly betting that the current deal will not go through.

i2 Technologies Stock Price

The market has undergone a seismic shift since August 11th, when JDA and i2 inked the deal.  Since then, JDA’s stock price has continued to track the market tightly, while i2’s was artificially suspended near the merger price.  When JDA announced that it wanted to reprice the deal, i2’s share price quickly adjusted to reflect new market realities.  i2’s board should view i2’s current stock price as an indication of what the company is worth today on a stand-alone basis.

At $8.89 per share (Friday’s close), the market values i2 at 4.6x EBITDA before stock compensation expense.  This is roughly equal to the average of the multiples of its closest public comparables: Manhattan Associates (Nasdaq:MANH), which trades at 5.4x EBITDA, and JDA itself, which trades at 4.1x EBITDA.

The deal that JDA wants to retrade values i2 at over 7.7x LTM EBITDA, a premium of over 65% to its current market value and to the average comparable values. This is too rich of a deal for i2 shareholders.  A more reasonable price for i2 would be about 6x LTM EBITDA before synergies, or approximately $11.50 per share.  This would be a 30% premium to the current market price – a decent win for i2 shareholders – and would be fair to JDA because the price relative to EBITDA after synergies would be about the same as JDA’s current market multiple[1].

Rather than an all-cash deal, I would like to see some of the consideration be in JDA stock – ideally an amount of stock that would bring pro forma net debt to below 1x pro forma EBITDA.  The current deal would leave the combined company with net debt of approximately $350 million, which is well over 2x pro forma combined EBITDA – very high leverage for a technology company. Add to that a minimum EBITDA covenant of $130 million (revised down from $136 million on 9/29/08), and the risks become intolerable. (For comparison, SAP (NYSE: SAP) has no debt and over $2 billion of cash and Oracle (Nasdaq:ORCL) also has about $2 billion of net cash.) Given the economic environment, the risks and challenges associated with post-merger integration, the fierce competitive environment for SCM and enterprise software, and the need to have liquidity for capital investment and small strategic acquisitions, it seems unwise for JDA to take on the amount of debt needed to finance the current i2 deal – no matter what the terms.

The shareholders of i2 would be much better off with a lower price than with a busted deal.  The potential $20MM break-up fee would do little to make up for the loss of an acquisition premium.

I own JDA stock at an average cost of about $12 per share, and I expect it to appreciate substantially with or without an i2 deal.  JDA is known for its supply and demand chain solutions for consumer goods retailers, manufacturers and wholesaler/distributors.  As retailers and manufacturers look to drive earnings through margin improvement in a slowing retail environment, JDA stands to benefit because its solutions deliver real value.  JDA has a strong management team, which has proven its ability to balance growth and cash flow.

On October 20th, JDA announced record revenues and EBITDA for the third quarter, and reiterated its confidence in its full-year revenue and profit guidance.  Using very conservative growth assumptions, discounting management’s optimism and assuming a recessionary environment over the next 18 months, I put a target price on JDA’s stock of $18 per share.  I base this on normal industry multiples as well as discounted cash flow analysis.

If JDA were to proceed with the i2 acquisition on the present terms, I would lower my price target and sell my stock.  The current price for i2 is too high; the resulting net debt is too high, and the minimum EBITDA covenant is too restrictive.  If the price for i2 comes down, and the deal is restructured to reduce pro forma net debt and eliminate (or significantly lower) the minimum EBITDA covenant, I will increase my price target for JDA by $3-$4 per share.  If JDA abandons the deal, I will keep my $18 price target – and my JDA stock.

__________________________

[1] From JDA’s viewpoint, the current acquisition price is about 5.3x LTM EBITDA after synergies, a significant premium over JDA’s 4.1x market multiple.  In its presentation regarding the merger, JDA projected $20 million of cost synergies, offset in the near term by $6 million of “dis-synergies” reflecting integration costs.  At the $14.86 price, JDA would be paying for all of the synergies and handing that value over to i2’s shareholders in cash.  A price of $11.50 per share would result in an enterprise value for i2 of approximately $270 million, or 4.1 times the pro forma LTM EBITDA for i2 with synergies (assuming the same debt and cash figures as used to calculate the enterprise value of $346 million based on the $14.86 price, and ignoring the $6 million of “dis-synergies”).

Copyright © 2008-2009 by John G. Appel. All rights reserved. You may link to any Content on this website. You may not republish, upload, post, transmit or distribute any Content without prior written permission. If you are interested in reprinting, republishing or distributing Content, please contact John Appel via the e-mail address shown on this website to obtain written consent. Modification of Content or use of Content for any purpose other than your own personal, noncommercial use is a violation of our copyright and other proprietary rights, and can subject you to legal liability. Disclaimer: This website is provided for informational purposes only. Nothing on this website is intended to provide personally tailored advice concerning the nature, potential, value or suitability of any particular security, portfolio or securities, transaction, investment strategy or other matter. You are solely responsible for any investment decisions that you make. Terms of Use: By using the site, you agree to abide by the Terms of Use, which includes further copyright information and disclaimers.

Cott Corp. – Could go Far, But Somebody Needs to Grab the Wheel

Cott Corp. is the world’s largest supplier of retailer brand soft drinks, and the fourth largest nonalcoholic beverage maker.  Given the recent growth trends in private label, Cott should be doing well.  Unfortunately, in 2006, when faced with slowing growth and shrinking margins, instead of striving to become a better and more efficient producer, the company abandoned its historical business plan and entered the uncharted territory of enhanced waters and energy drinks – with its own brands.  This plan failed miserably: Cott alienated its core retail customers; healthy profits turned to losses; and debt mounted to the point that the company can barely service it.

In May 2006, Cott’s board pushed out its CEO, John Sheppard, who had built EBITDA to roughly $200 million through acquisitions and a focus on efficient manufacturing, and brought in a new CEO, Brent Willis, to execute the new plan.  From then until March 2008 when Willis departed, Cott’s stock dropped from $15 to $2 per share, wiping out nearly $1 billion of equity value.  Today, it trades at around $1.00 per share, less than tangible book value.  As I explain below, this could be an $8.00 stock if the company successfully implements its plan to cut costs and return to its roots.  But it is a long, long way from here to there.  If the company does not get capable leadership soon, it may never get there.

Crescendo Shakes Things Up

Activist investor Crescendo Partners must have seen the upside opportunity when it purchased 8.7% of the company’s stock between March and May of this year.  Crescendo installed four new directors and proposed that the former VP of Canadian Operations and Global Sourcing for Cott, Csaba Reider, become CEO.  Crescendo then pushed the company to slash costs and get back to basics.  On June 19th, the company announced its plan to increase cash flow by $39-43 million by refocusing on its core business, cutting G&A expense, and improving the efficiency of its bottled water operations.  The cost cuts started with the elimination of several senior executives.

Unfortunately, the damage done by Cott’s management may have been worse than even Crescendo realized, and the path to profitability looks pretty long and bumpy.  It may take complete board control, not just the influence of an activist investor, to steer this company back into the clear.

Highly Leveraged – The Natives Must Be Restless

With debt approaching 5x run-rate EBITDA – and 8x run-rate EBITDA less normalized CapEx[1] – the company’s balance sheet may force some sort of recapitalization, or reorganization, before the company is able to execute this plan.  Cott’s $269 million of 8% Senior Subordinated Notes are due in just over three years.  Its new ABL facility ($131 million drawn as of 6/28/08 ) also comes due at that time if the 8% Notes are not refinanced before then. The 8% Notes, which were recently downgraded by both S&P and Moody’s and trade at a significant discount, will not be easy to refinance.

A patient lender, with confidence in management, would give the team the runway to execute a turnaround.  But who would trust this team?  The quality, consistency and transparency of its financial reporting, the reliability of its communications to investors, and the execution of its current turnaround plan have all been disappointing.

Crisis of Confidence

It’s hard to believe in a company when you can’t rely on its financial statements.  Cott’s auditors have sited significant internal control issues affecting the accuracy of its financial statements, and state that “management oversight… could not be relied on to mitigate [these issues].”[2]   Recent events indicate that despite management changes earlier this year, things have not gotten better.

In its second quarter earnings call on July 31st, management said that it expected “adjusted operating profit” for 2008 to be 50% to 70% above 2007’s figure of $36.3 million.  On the call, an analyst challenged this assertion, stating that given that adjusted operating profit for the first six months was approximately zero, “something fairly heroic has to happen in the next six months” to meet those projections.  Management defended its position.  However, less than a month later, on August 26th, the company said it would not hit these targets and revised its 2008 guidance downward dramatically, saying that adjusted operating profit would range from down 5% to up 28% versus 2007. I think this is still optimistic.[3]

On July 31, management said that the reduction in shelf space at Wal-Mart didn’t seem to be having a material negative impact on sales; that they were on track to deliver their cost savings plan; that their “water project,” which was to deliver over half[4] of the roughly $40 million in cash flow increase from the turnaround plan, was going smoothly; and that they and a commodity cost advantage over their competition this year.  By August 26th, they said that the sales decline was more severe than anticipated due to heavy promotional activity by competitors; their savings targets for this year would not be met; the water project was hampered by cost overruns and delays; and commodity costs were squeezing margins.

If management gives us positive news on the October 25th Q3 conference call, will they retract it a few weeks later? [Update – I have been told the call will now be in November]

The Clock is Ticking – With Lenders And Customers

Cott needs to move immediately to assure its customers that it is a capable, long-term partner, and assure its lenders and investors that it has a handle on its business.  This means hiring a CEO who will inspire confidence, and making the other management changes necessary to insure that the company can provide some reliable visibility into its future performance.  It is not clear that Crescendo’s CEO candidate is the right person for this situation.  Rather than somebody with no prior CEO experience, I would like to see a seasoned company leader with real turnaround experience at the helm.

If the company does not act quickly, its customers and lenders will lose confidence completely, taking the company into a downward spiral from which it may not be able to recover.  Its retailer customers need a manufacturer for their store brand beverages, but Cott is not their only choice for private label production.  Dr Pepper Snapple Group (NYSE: DPS) and National Beverage (Nasdaq: FIZZ)[5] also have meaningful private label operations and capacity.  It is not clear if they have enough capacity to service Wal-Mart and all of Cott’s other customers, but if Cott were to lose Wal-Mart, DPS and National Beverage could buy whatever additional capacity they needed from Cott’s lenders for pennies on the dollar.

Low Stock Price Does Not Mean Good Value

At $1.00 per share, Cott’s total equity value is about $72MM and the enterprise value is approximately $500MM, as shown below.  (This value assumes that any discount one could get on the company’s 8% subordinated notes is offset by non-debt liabilities not included in this enterprise value calculation.)

Enterprise Value at $1.00 Share based on 6/30/08 Balance Sheet ($MM):


At this price, the enterprise value is 5.4x my estimate of adjusted EBITDA for the twelve months ended 6/28/08, and 5.7x my estimate of run-rate adjusted EBITDA (see “Financial Summary” below for EBITDA calculations). If one believes in the turnaround, the price is low, because it is only about 4x pro forma adjusted EBITDA after turnaround savings.  If one has completely lost faith in management, the price is high and does not reflect negative sales trends and significant default risk.  The current market price seems to suggest that the turnaround upside and default risk downside roughly offset each other.

Current Stock Price Still has Big Downside Risk

If confidence is not restored soon, default risk may become the dominant issue, in which case the stock price should go below $0.50 per share.  At $0.50 per share, the company would be valued at about 5x adjusted EBITDA.  One could argue that even this multiple is high, and that the company is not worth more than its debt, but I won’t go that far.  The replacement value of its manufacturing assets and the value of its rights to the RC Cola brand internationally should put a floor on the equity value.

G&A Needs Further Cuts

Cott needs $40-$50 million of additional EBITDA right away just to get its leverage down to a comfortable level.  Thus, the maximum $40+MM of savings from the turnaround plan MUST be achieved ASAP.  To make success more certain, Cott should target deeper cuts in the primary controllable cost: G&A.  Instead of sizing G&A to where the company wants to be, it should size it to where it is headed today.  The planned G&A cuts should be $30MM, not $20MM.  This will provide more certainty that the total savings can be achieved soon even if the operational/COGS fixes take longer than planned.

The company needs to adjust not only head-count, but also salaries and board fees.  Last year, the board of directors paid itself a whopping $1.8 million in cash director’s fees.  The interim CEO, David Gibbons, is being paid at a rate of $850,000 per year (including directors fees), plus a grant of 720,000 shares of stock.  Their current CFO made $800,000 in total comp for 2007. How can this be justified?

Crescendo’s CEO candidate has agreed to work for a salary of $625,000 and a bonus of up to 100% of salary.  How about a salary of about $400,000 and a performance-based bonus plus stock options to make up the difference?  Cott needs a leader who will bet his paycheck on his performance.

The Upside – Possibility or Pipe Dream?

With $40-$50MM of additional cash flow – initially driven by G&A cuts and later by the “water project” and improvements in the company’s business model – EBITDA could get to $120-130MM and debt would be reduced to below 3.5x EBITDA (see “Financial Summary” below).  With a return to growth and profitability taking the EBITDA multiple up to 8x, the company’s stock could be worth $8.00.

But without new leadership, this seems like a pipe dream.  The way things are going, it seems more likely that weak revenues and cost overruns lead to a cash crunch, which could lead to a death spiral.

Great Meal for a Vulture

Now is the time for action by an industry acquirer, or a private equity group with the ability to capitalize Cott properly.  Several other firms have circled Cott in recent years, but now this deal may have gotten too small for them.  Likely strategic buyers are National Beverage and Dr Pepper Snapple Group.  DPS is still highly leveraged after its “demerger” with Cadbury and has a number its own issues to deal with, so FIZZ, which has no debt, is probably the better acquirer at the moment.  Cott would also be a great fit with Polar Beverages, which has a strong position in the Northeast.  Ralph Crowley, Polar’s CEO, has a good eye for a bargain.

The Numbers

Below is a summary of historical income statement data, along with my estimate of run rates as of 6/30/08, including adjusted operating profit, and my view on adjusted EBITDA.  I have added a pro forma run rate adjusted EBITDA figure, factoring in management’s expected savings from the turnaround plan. The market seems to be anticipating adjusted EBITDA in the mid-$80MM range, but an EBITDA of $125MM or more seems to be within reach.  If Cott had the right leader, it would be a lot easier to imagine that possibility.  At the moment, it seems easier to imagine a restructuring.

______________________

(a) Annualized by applying 6-month growth rate to 2007 full year figure.
(b) Annualized revenue multiplied by the ratio of LTM COGS to LTM revenue.
(c) Equal to LTM figure.

______________________

[1] In the Q2 earnings call, management said that capital expenditures should be $30-$35 million next year, excluding the “water project.”  I assume this is “normalized” capex.

[2] In its 10-K filing for 2007, the company states that it had “material weaknesses” in its internal controls, “… affecting the financial statement balances of cost of sales; selling, general and administrative expenses; accounts receivable; amortization; income tax (benefit) expense; accounts payable; intangible assets; deferred income tax assets and shareowners equity recorded in the financial statements as of December 29, 2007.”  It also said that, ”… management oversight within the financial close process … could not be relied on to mitigate the segregation of duties internal control deficiencies.”

[3] In my Financial Summary, I estimate the run-rate adjusted operating profit to be approximately zero as of 6/30 based on year-on-year trends.  Given the lack of progress on operational improvements and continued deterioration in revenue, I think that 2008 adjusted operating profit is more likely to be down 100% than down 5% as predicted by management.

[4] Cott management said that the “water project” would take their water business, equal to 17% of North American revenue, from a zero gross margin to a “fair” gross margin.

[5] If one wants to be long in this sector but does not have the stomach for Cott, National Beverage could be an interesting pick.  It has steady cash flow and no debt, and trades at about 7x EBITDA….

(Disclosure: the author is long COT stock)

Copyright © 2008-2009 by John G. Appel. All rights reserved. You may link to any Content on this website. You may not republish, upload, post, transmit or distribute any Content without prior written permission. If you are interested in reprinting, republishing or distributing Content, please contact John Appel via the e-mail address shown on this website to obtain written consent. Modification of Content or use of Content for any purpose other than your own personal, noncommercial use is a violation of our copyright and other proprietary rights, and can subject you to legal liability. Disclaimer: This website is provided for informational purposes only. Nothing on this website is intended to provide personally tailored advice concerning the nature, potential, value or suitability of any particular security, portfolio or securities, transaction, investment strategy or other matter. You are solely responsible for any investment decisions that you make. Terms of Use: By using the site, you agree to abide by the Terms of Use, which includes further copyright information and disclaimers.

Jamba Juice: Not the Rights Offering I was Looking For….

Jamba Juice announced last week that it has adopted a “poison pill” in the form of a Stock Purchase Rights Plan [1].  However, the rights plan I would like to see would have nothing to do with takeover defenses.  Instead, it would address a more fundamental issue: the company’s need for cash.  The depressed valuation that motivated the poison pill reflects investors’ fear that the company is headed for bankruptcy.   Jamba needs an immediate balance sheet fix, to restore investor confidence and ensure the company’s long-term survival.  This should be funded by equity, not by debt, and not by selling stores for pennies on the dollar to franchisees that are smart enough to recognize a bargain.  A rights offering would be the fairest and most effective way to achieve this.

If the company’s stores were in good shape and the business model worked well, the solution would be easy: cut costs and new store development to generate cash and just ride out the next couple of years.

Unfortunately, Jamba cannot afford to do this.  The stores need investment (I was probably $10 million light in my previous analysis), and the concept needs to be evolved so that it is not just viewed as an expensive treat.  Thus, Jamba needs to spend to survive.  This is a terrible place for a company to be today, but I am afraid this is the reality for Jamba.

The $25 million credit facility does not solve the company’s problems.  The market is smart enough to know that if debt is used to fund spending in excess of cash flow, it can make things worse, not better.

To attract cash investment, the company also needs to address its other problem: lack of a permanent CEO and a well-defined plan for success.  Jamba has described some of management’s priorities, but no plan will be taken seriously unless presented by the CEO who will execute it.

Here is my proposal:

  • Step one: Hire a new CEO with the right credentials and a convincing plan, or have Jamba’s Chairman and Interim CEO, Steven Berrard, step up to guide the company through the next few years.  Steven is a very smart and capable leader, having been CEO of both AutoNation and Blockbuster.  Either way, this needs to happen immediately.
  • Step two: Reverse split, say 1-for-10.  This gets the stock price well above $1 per share, removing the threat of a delisting, and making the stock acceptable to analysts and investors who have policies against penny stocks.
  • Step three: Rights offering giving shareholders the right to participate pro rata in an equity offering big enough to instill confidence among shareholders and enable management to execute its plan – say, $15-20 million.

The company’s current plan, to raise cash by “refranchising” is neither adequate nor fair.  Selling company-owned stores to selected franchisees can be just as dilutive as an equity offering, but does not give shareholders the ability to make themselves whole through a new investment.  In each case, Jamba obtains cash by selling a piece of the company at today’s depressed values.  With refranchising, the company sells a piece of itself to a select group of insiders: franchisees.  With a rights offering, the company offers the piece pro rata to each of its shareholders.  Those shareholders who participate in the offering are not diluted.

Even if one could argue that refranchising some stores made strategic sense, now is not a good time.  It is extremely difficult today for franchisees to obtain debt financing to purchase stores. Those stores that are sold are likely to go at a deep discount.  The franchisees that can afford to buy company-owned stores now are probably parsimonious operators, who, especially in these times, would not buy unless they got a bargain.  Their gain is the shareholders’ loss.

As for the stock split, it is clear that company fundamentals will not push the stock comfortably and consistently above $1.00 per share for a long time.  Jamba’s board seems to admit this in the “Summary of Terms of Rights Agreement,” which states: “$7.00 … is the amount that in the judgment of the Board of Directors represents the long-term value of one share of Common Stock over the [10 year] term of the Rights Agreement.”  If one takes a potential value in 10 years of $7.00 per share and discounts it at a reasonable rate of return for a security with this level of risk, they get a present value that is not out of line with today’s share price.  At the traditional private equity return goal of 35%, the present value is $0.35 per share.  At a rate of 25%, the present value is $0.75.  At a rate of 15%, the present value is $1.73.

A natural question is, “what happens if the company throws a party and nobody shows up?”  Jamba can do several things to ensure that a rights offering is adequately subscribed.  First, it must make the price attractive, which can include attaching warrants for additional shares.  It can also have the offering underwritten.

When a company’s stock is under pressure, a rights offering is often the most effective means of raising equity.  It is also the fairest.  I hope Jamba does something soon.

______________________

[1] Some form of “shark repellent” seems warranted, given that the market now values Jamba at less than 1x store-level EBITDA.  However, with a 15% trigger, the Rights Plan seems to be as much about deterring activist investors from shaking things up as about deterring a hostile takeover.

GE Franchise Finance Hits the Brakes

Nation’s Restaurant News reported on Friday, and Dow Jones reported today, that GE Franchise Finance is becoming ‘much more selective’ and has stopping making new rate quotes until things ‘settle down.’  They will continue to honor existing commitments.  This follows rumors that BofA declined to make financing available to the McDonald’s Corp. franchise system to fund capex related to its new espresso initiative.

This trend will make it more difficult franchisors to execute “refranchising” initiatives that have been announced not only by Jamba, but also by chains such as Sonic, Jack-in-the-Box, CKE (Carl’s Jr. & Hardee’s), DineEquity (Applebee’s & IHOP), and Panera.

Jamba Juice: Work in Process, but Rumors of Its Demise Greatly Overstated….

Jamba Juice is a BUY, especially for a private equity group with a longer-term view than the public markets, or for Starbucks or another industry buyer that can help develop the long-term opportunity in this space.  Jamba Juice certainly has its challenges, but for somebody that understands these challenges, a price of about $1.00 per share represents the opportunity to own a top “healthy lifestyle” brand, and the leader in the made-to-order smoothie market, for under 2x store-level cash flow (and a very attractive pro forma EBITDA multiple, as described below).

Why do I care about Jamba? I am a former director of Robeks, a 150-store premium smoothie franchise system, and I have a stake in the success of Robeks, and thus the success of the whole category, so of course I care about the category leader, Jamba Juice (yes, I’m also long JMBA stock).  From my due diligence before leading my former employer’s investment in Robeks, and my experience as a Robeks director, I have learned a lot about the smoothie category, and am in a unique position to evaluate Jamba.  First, let’s recap briefly what Jamba Juice is, then let’s take a look at the numbers.  Next, we’ll look at some of the big picture challenges facing the company.  At the end of this piece, I’ll give my views on what Jamba’s management should do to ensure that the company has an enduring reason for being.

Category Leader in Made-to-Order Smoothies

Jamba is the category-defining leader in made-to-order smoothies – more than 3x the size of its closest competitors: Smoothie King and Freshens. This is thanks in large part to average unit revenues that are far above industry norms.  Jamba had 736 locations as of July 15, 2008 (518 company-owned), and $317 million in revenue for the year ended 1/1/08.   System-wide revenue is about $450 million.

Healthy Lifestyle Brand

While Jamba stores often do not have the seating capacity and café ambiance of a Starbucks, the chain comes the closest to delivering a Starbucks-like experience – but with a “healthy lifestyle” positioning.  The company delivers a consistent, premium, fun and healthy product and in-store experience for its customers.  An increasing focus on healthy living is here to stay, and Jamba can be a leader.

To be successful, Jamba needs to make the smoothie the centerpiece of its healthy lifestyle strategy, and position the smoothie as a healthy alternative to a meal, rather than a healthy alternative to a milkshake.  As a meal substitute, a $6 smoothie is a good value; as a treat, a $6 smoothie is an overpriced indulgence and the first thing to go when consumers are saving their pennies.  Jamba is ahead of the pack in recognizing this, but has a long way to go in executing it (more on this later).

Jamba by the Numbers

Here is my calculation of JMBA’s enterprise value at $1.00 per share (amounts in thousands): *

____________________________________________
* Since the bulk of its employee options are way underwater, I assume that 2.6 million shares (5% of the total) eventually will be issued so as not to lose key employees (just a SWAG).  On 9/11/08, Jamba issued 2MM common shares to affiliates of Victory Park Management (“VPM”) in connection with the issuance of $25MM in senior notes to VPM.  Rather than adding this to outstanding shares for valuation purposes, I view this as a $3MM liability, since the shares are subject to a put-call arrangement at $1.50/share.  The $10MM reserve is a big SWAG.

By my math, at $1.00 per share, the company trades at 1.6x store-level EBITDA, 4.0x my estimate of run-rate EBITDA, and 2.9x my estimate of pro-forma run-rate EBITDA reflecting all of management’s planned cost cuts.  Imagine how accretive this would be for Starbucks, which trades at 9x EBITDA! (For comparison, BWLD trades at 13x EBITDA, PEET trades at 12.5x EBITDA, KONA and PFCB at 6.8x EBITDA).

Below is my estimate of Jamba’s normalized EBITDA (1).

____________________________________________
(1) Figures are from the company’s latest 10-K and 10-Q.  The pro forma cost cut figure is from the company’s 8/28/08 earnings call, a transcript of which can be found at Seeking Alpha.  On the call, management said that $9MM of a planned $15MM in annualized cost cuts had already been implemented. (2) Includes charges for trademark impairment, store impairment, lease termination, asset disposal, and equity loss on JVs. (3) Figure for FYE 1/08 is “store-level operating income” as reported in the company’s 3/13/08 earnings release.

I can see why the stock has been trashed.  How often do you see an operating loss equal to a company’s revenue?  But I assume that many can look past the intangibles write-offs and focus on EBITDA.  Unfortunately, LTM pro forma normalized EBITDA is still negative!  But at least the red is coming from 2007; 2008’s figure is $8.5MM.  Back-of-the-envelope, I estimate run-rate EBITDA to be $15MM, or just under 2x normalized EBITDA for YTD 7/08.  (This estimate assumes that continuing negative same-store traffic offsets any short-term boost from the company’s deal with Nestle for bottled smoothies – which looks promising).  To get pro-forma post-expense-cut EBITDA, I add another $6MM – the difference between management’s planned $15MM of expense cuts and the $9MM of cuts made to date – to get $21MM of EBITDA.  Today’s enterprise value is 2.9x this figure.  Yes, there is a leap of faith in the $21MM number, but there is no leap of faith in the $37MM of store-level cash flow.

Competition, and Execution Risk

Of course, 3x EBITDA or 1.6x store-level cash flow is only a good deal if one thinks there is a growth story here.  Restarting growth is subject to big competitive and execution risks. The market has definitely become more competitive.  The company and investors are concerned about the wave of new competition from QSRs and coffee chains, including Jack-in-the-Box, Taco Bell, McDonald’s, Dunkin’ Donuts, Starbucks and more.  Seeing this competition invites a long-standing question for the smoothie category: do smoothies really deserve their own store or are they just a product line for another store concept? The answer may be that a basic smoothie is more of a product line, no more deserving of it’s own store than a milkshake.

Smoothie shop chains have all struggled with the fact that while some customers will have a smoothie for breakfast or a light lunch, most people seem to view smoothies as an a between-meal snack, treat or pick-me-up.  In order to get enough traffic to drive sustainable store-level cash flow, and level-out seasonality, many stores have resorted to selling other traditional food items, such as salads, sandwiches, soups, baked goods and coffee.

This is the wrong strategy. As smoothie shops begin to offer the same food items as QSRs and coffee shops, they expose themselves to competition as QSRs and coffee shops offer smoothies.  If a smoothie shop brings in more traditional mealtime food for those day parts, they reinforce the notion that a smoothie is not a meal.  Instead, they need to evolve the smoothie product and experience so that customers recognize that it can be a healthy meal-in-a-cup rather than just a treat.  Any additional food items should really be unique, not things offered at Jack-in-the-Box.

If fresh smoothie chains don’t move in this direction, the QSRs and coffee chains will eat their lunch, or perhaps I should say drink their smoothies….  It’s a lot easier for a QSR or quick-casual chain with an already successful business model to add smoothies than for a smoothie chain to fix its business model by inventing a whole QSR or quick casual business.  Frequent smoothie drinkers, even in fitness-crazed California, generally say that a smoothie is a smoothie is a smoothie.  And, sweet flavors sell well.  The QSRs are leveraging this and will take a chunk of the market for sweet, treat-like smoothies.

This will put some smoothie chains out of business, but Jamba has a chance to thrive as a destination for healthy, on-the-go meals or mini-meals that are NOT traditional QSR fare.  After experimenting with soups and other more traditional meal items over many years, Jamba finally seems to get this.  Recently, they introduced breakfast smoothies, which, while not executed as well as they could be, represent a move in the right direction (smoothie-as-a-meal).  With their new menus, they also introduced a “Functionals” line of pre-boosted smoothies grouped by functional benefit.  These are positive steps, but the next CEO of Jamba will need to take this much further, or see much more of Jamba’s business go to the burger and coffee chains.

Starbucks apparently sees it the same way, and has put a health and nutrition spin on its smoothie offering rather than competing directly with treat-like smoothies from QSRs.  They call their offering a “Vivano” rather than a smoothie, and incorporate whey protein (instead of just offering it as a “boost”) to make it more of a meal replacement.  Unfortunately for them, they have not quite gotten the taste thing figured out yet.  Jamba should be able to beat Starbucks in both health and taste.

The Bottom Line

Jamba has a big execution challenge ahead of it – made worse by the fact that they don’t have a permanent CEO!  Given the huge amount of uncertainty right now, a price of $1.00 is not unreasonable, but once a permanent CEO is hired, I would value the business closer to 6x pro forma run-rate EBITDA, or 3x store-level EBITDA, which is about $2.00 per share.  This would still be a discount to the public comparables because of the fundamental issue that they have never been able to get to a stable, proven, optimized business model that can simply be “stamped out” in new stores.  Instead, they still need to figure out exactly how to be the “healthy lifestyle” chain they say they want to be. Until they get a new CEO, it will be hard to handicap their ability to pull this off.  But Jamba is the best positioned of all the smoothie chains to succeed with this strategy.  They have built a very strong brand, which already stands for the things the company wants to be.  My guess is that the answers are already somewhere in Jamba’s product development pipeline and that the company just needs the leadership to execute them.  Once Jamba can point to a clear vision for how they create a compelling value proposition for the consumer and a sustainable business model, I would value the business at closer to the comps, which would equate to about $3.00 a share.

At any valuation, Jamba really should not be a public company.  It’s too small and has too much left to figure out.  Instead of spending close to $7 million on accounting and legal fees (not all, but much of which is a cost of being public), the company should reinvest this in growth.  A smart acquirer like a Starbucks, or a PE firm with the right in-house talent pool, could get to $3.00 a share of value quickly, so they would be well rewarded for purchasing Jamba at even a 100% premium to today’s price.

PS – My 2 Cents on What Jamba Should Do

1. Make the breakfast smoothies easier to eat.  The current breakfast options are served with a straw that is too narrow, and a spoon.  Who wants to eat a smoothie with a spoon?!  One needs to be able to finish their smoothie while driving and not get in an accident.  Breakfast smoothies are a great opportunity to demonstrate that one can indeed have a smoothie for a meal, but you need to deliver or you’ve done more harm than good.

2. Add more high-protein smoothie options, and use more ingredients that promote satiety, such as natural inulin and fruit fibers, so that people feel full and satisfied after a smoothie to the same extent that they would after a more traditional meal.  These should be positioned on the menu as meals.

3. Offer coffee smoothies, and maybe even coffee.  A process exists for retaining more of the natural antioxidants of coffee after the roasting process.  Jamba could serve a proprietary, organic, high-antioxidant coffee and stay true to its brand image.

4. Add more proprietary savory food items.  The proprietary food needs to taste better!  As long as there are some healthy hooks, such as omega-3 fats, heart-healthy amounts of fiber, or high antioxidant levels, it should do well.  Consumers love to rationalize that something that tastes decadent is actually good for them.  And, at least in moderation, it can actually be true!

5. Get some meal-replacement items into the Nestle line-up.  Right now, the bottled product takes the brand in too much of the sweet, treat direction.

Copyright © 2008 by John G. Appel. All rights reserved. You may link to any Content on this website. You may not republish, upload, post, transmit or distribute any Content without prior written permission. If you are interested in reprinting, republishing or distributing Content, please contact John Appel via the e-mail address shown on this website to obtain written consent. Modification of Content or use of Content for any purpose other than your own personal, noncommercial use is a violation of our copyright and other proprietary rights, and can subject you to legal liability. Disclaimer: This website is provided for informational purposes only. Nothing on this website is intended to provide personally tailored advice concerning the nature, potential, value or suitability of any particular security, portfolio or securities, transaction, investment strategy or other matter. You are solely responsible for any investment decisions that you make. Terms of Use: By using the site, you agree to abide by the Terms of Use, which includes further copyright information and disclaimers.